When resilience means keeping the water flowing
What the Drinking Water Inspectorate’s new sufficiency guidance means for resilience and investment planning.

Resilience has always presented the water sector with a problem: nobody quite agrees what it means. Now it is beginning to acquire a definition. The Drinking Water Inspectorate’s new sufficiency guidance does something significant — it turns an abstract concept into something that can be assessed, measured and acted upon.
01Moving towards a definition
In Resilience runs on two clocks, we argued that this ambiguity is part of the term’s usefulness. An undefined concept allows us to fall back on older metrics we are comfortable with, while responsibility becomes diffused beyond usefulness.
The Drinking Water Inspectorate (DWI) published new guidance in August on delivering water sufficiency through the drinking water safety planning approach, accompanied by an information letter to Board level contacts, scoring matrices for hazardous events and criticality, and a structured reporting template. Water companies are expected to assess sufficiency risk across their supply systems, with a trial submission planned for March 2027 and reporting expected by October 2027.
Finding no consensus on a definition, or on methodologies and ways of monitoring, the Inspectorate’s own research reached a similar conclusion from a different direction. Its response has been to define sufficiency operationally — a continuous supply of wholesome water in adequate quantity and pressure for domestic purposes — and to position this as a practical, measurable indicator of both resilience and asset health.
Sufficiency is defined at the customer end of the system and experienced within the day, whilst the investments that largely determine it (storage, treatment capacity, trunk routes, renewal) are decided across years and AMPs. The new framework is arguably the first regulatory submission that requires both clocks to be reconciled in a single artefact.
02What the guidance asks for
The mechanics will be familiar to anyone who has worked with drinking water safety plans. Supply systems are assessed from source to tap and broken into stages (catchment, abstraction, treatment, storage, distribution), with a defined set of hazardous events at each stage, scoring matrices to apply, and reporting through a structured template in the style of risk lines. Criticality is scored per asset, risk is carried forward from one stage to the next, mitigation status is recorded against the familiar A to J categories, and review frequency is tied to the risk score, from monthly at the top of the scale to annually at the bottom.
Two features stand out when the documents are read together. The first is that the guidance is explicit about the need for a systems view, whereby water companies are asked to identify critical nodes and critical pathways, to consider island zones that cannot be rezoned, and to treat failure of upstream processes as a consequence for downstream sufficiency. The second is that the framework is designed to drive investment rather than reporting alone, with the later stages asking companies to plan prioritised, evidenced mitigation across short-, medium- and long-term horizons. Both features are welcome, and both raise the question of what happens between the register and the programme.
03Criticality and the network around the asset
If we read the criticality matrices, we can see that the scores are not just about the asset: a borehole scores on whether other sources can replace it, an intake on whether standby or alternative routes exist, treated water storage on how many hours of downstream supply its headroom represents, and a distribution network on whether rezoning is available or the zone is an island. Criticality, as defined here, is a measure of the alternatives around an asset rather than of the condition of the asset itself.
Some challenges will still exist even with this approach: a criticality register ages every time the network changes, because an investment that adds a route, a connection or headroom changes the score of assets it never touches; an asset’s criticality can be reduced by spending somewhere else entirely, and in some cases that will be the cheaper and more valuable intervention. We made a similar argument previously in terms of the responsible diffusion of risk, where genuine surplus built in one part of a system was used to offset exposure in another, and the criticality matrices give that argument a regulatory expression, since surplus fed back into a zone would move its scores without a single asset in the zone being improved.
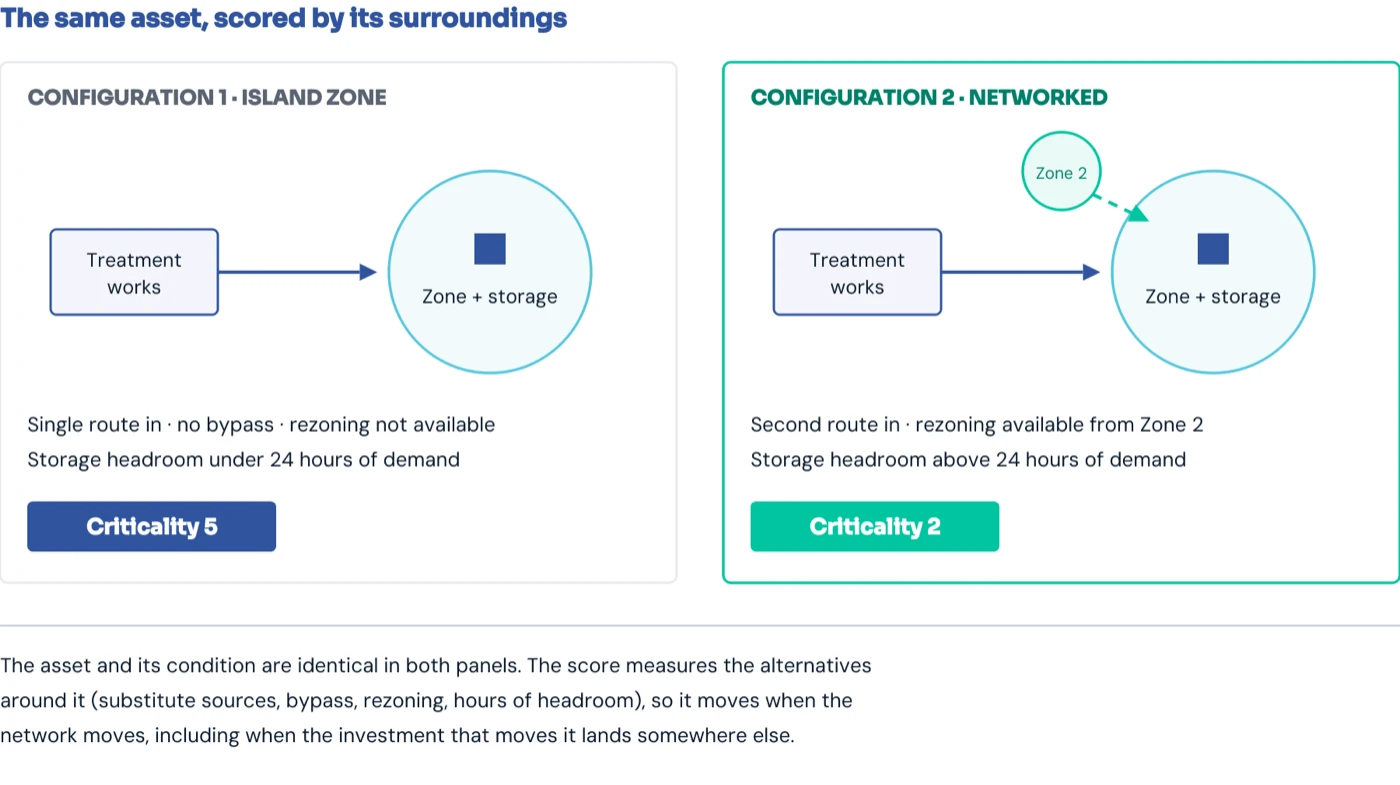
Figure 1. The same asset in two configurations. Nothing about the asset differs between the panels; the criticality score belongs to the network around it, and moves when the network moves, including when investment lands somewhere else.
04Where risk appears and where it is controlled
Category G records that no mitigation is in place because the control point is downstream, and category J records a carried forward risk whose control point is upstream. The framework acknowledges, in its own way, that the place where a risk is observed and the place where it is controlled are typically different places in the system.
The carry forward mechanic will require careful consideration in our opinion. Risk is carried by taking the highest score from the relevant upstream stage, which is a reasonable simplification for a linear path but understates what happens in a real network, where the guidance’s own example diagram shows multiple routes, shared assets and potential connections. A per line register also cannot represent combinations, in that two mid scored events at different assets can jointly amount to a severe position (a works restriction coinciding with a storage outage, for example) whilst the lines read separately suggest a manageable one.
The guidance asks for a reasonable worst-case scenario, which is a sound discipline, although a single constructed worst case is one future, and the risks that matter most tend to reveal themselves when a range of futures is examined rather than one. In our experience, concurrent failure states of risks that have materialised separately before but not at the same time are often the highest risk states that the network can experience.
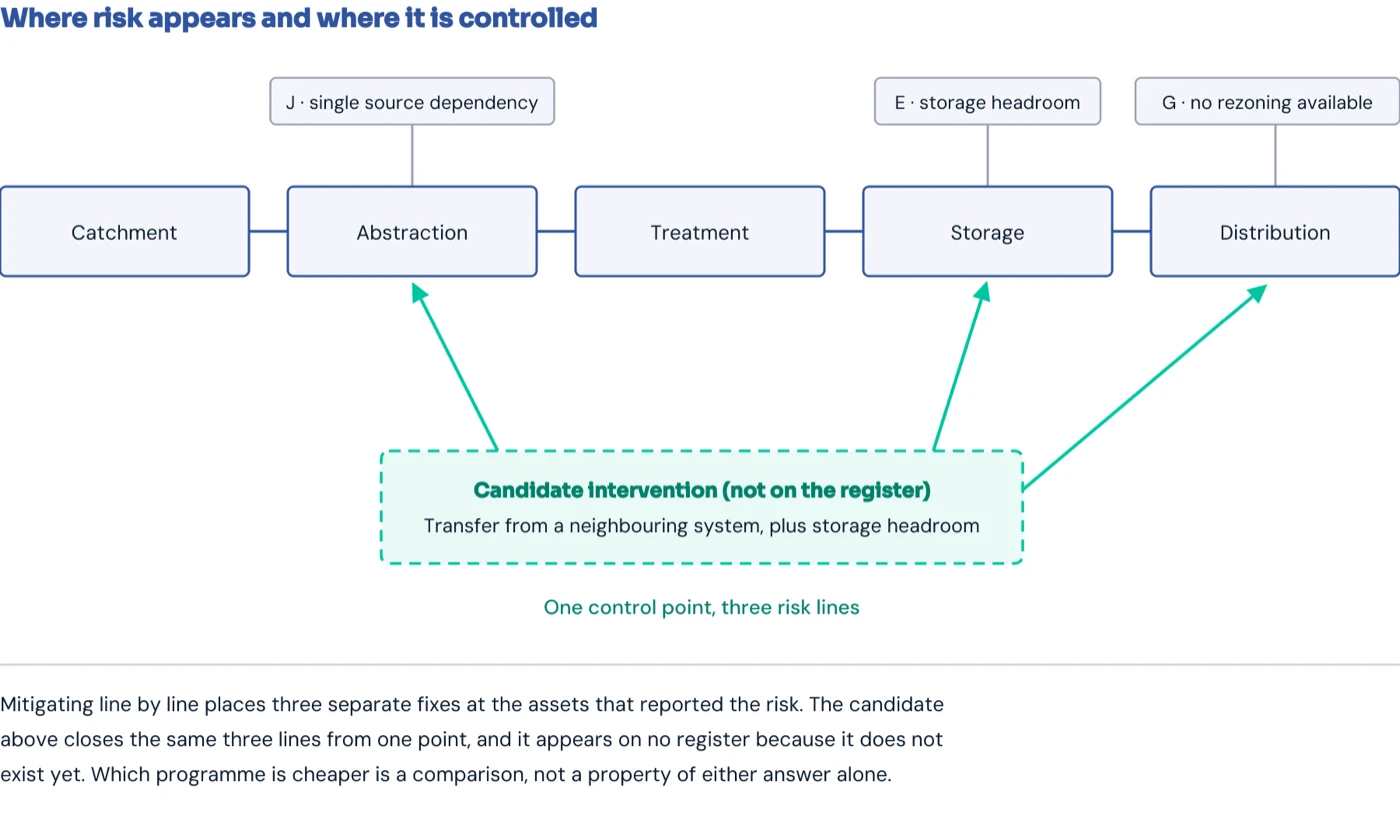
Figure 2. Three risk lines, one control point. Mitigating each line at the asset that reported it would place three separate fixes; a single intervention elsewhere can close all three, and only a comparison across the system reveals which answer is the efficient one.
05From risk register to investment programme
The later planning stages expect companies to use the reported data to plan prioritised, efficient and well evidenced investment. The natural reading of a register is to sort it and mitigate from the top, which may not always be the right approach. Fixing each risk line at the asset that reported it optimises each line against a local objective but may increase the cost of the system as a whole. Categories G and J are the framework’s own acknowledgement that the best control point may actually be a different node.
A ranked list of risk scores is an input to an investment programme rather than the programme itself, because the efficient answer is typically a system-based plan: combinations of interventions that resolve several risk lines at once, including options (a route, a transfer, headroom in a neighbouring zone) that appear nowhere on the register because they do not exist yet.
The guidance’s own worked example points in this direction, showing candidate future changes (a new service reservoir, a works expansion, additional boreholes, reuse into a second works) drawn as potential routes on the system diagram. The register tells you where the gaps are, whilst constructing and comparing the candidate programmes that close them is a separate exercise, and arguably where the value of the framework will ultimately be realised.
06Sufficiency reporting and the Cost Change Process
It is worth reading this guidance alongside Ofwat’s draft determinations under the Cost Change Process, published the same month, in which £143m was rejected in part for gaps in the options analysis supporting company requests. Taken together the two processes constrain the same gap from opposite ends. The Inspectorate’s framework requires water companies to enumerate their sufficiency risks from the bottom up, asset by asset and with evidence, whilst the funding process requires the chosen mitigation to demonstrate from the top down that it was the right option against the alternatives.
The step in the middle, generating the candidate options and comparing them across the whole system, is owned by neither process, and it is the step most current approaches and tools are weakest at. Hydraulic and hydrological models are adept at simulation of a fixed network representation rather than optimisation, which can change it, and will characterise a configuration in detail without running the head-to-head between configurations; we covered that trade at more length in the earlier paper, and the arrival of a mandatory sufficiency register makes it more pressing rather than less.
07Timing and preparation
In terms of timing, the Inspectorate intends to develop the method further with the industry during the remainder of 2026. A trial submission is planned for March 2027, and reports are expected by October 2027.
The constructive reading is that the Inspectorate has built a framework whose own categories already point towards systems thinking. The open question is whether water companies have the processes and capabilities to act on what the framework reveals.
We would suggest that the preparation that pays off is not simply completing the template but building the capability behind it: knowing which risk lines share a control point, which criticality scores would change if the network changed, and which combinations of interventions close the most gaps for the least cost. As the old adage goes, “plans are nothing, but planning is everything”.
Sources. Guidance on delivering water sufficiency using the DWSP approach, with accompanying hazardous event and criticality scoring matrices and reporting template (Drinking Water Inspectorate, August 2026); DWI Information Letter 02/2026 (3 August 2026); Ofwat Cost Change Process draft determinations (August 2026); Resilience runs on two clocks (BMA, 2026).
Note on examples. Observations drawn from client work are generalised; nothing identifies a specific network, scheme or organisation.
Regulatory position stated as at August 2026. The Inspectorate intends to develop the method further with the industry during the remainder of 2026.
The principles discussed in this article are reflected in the way Decisio supports integrated, evidence-based investment planning across complex infrastructure systems. Find out more about Decisio’s approach to integrated planning and infrastructure decision intelligence at decisio.ai.